Image Classification using PCA and LDA
Abstract
The pervasiveness of images on the internet make them a prime target for statistical analysis. However, the high dimensional nature of images makes them difficult to include in traditional statistical models. This paper explores the effectiveness of Principal Components Analysis (PCA) and Linear Descriminant Analysis (LDA) as tools for dimension reduction and classification of images into distinct populations.
Facial images of individuals from Centro Universitário FEI are classified as male or female, and smiling or neutral facial expression. The results suggest that PCA and LDA can be very efficient and accurate tools for classifying images into different populations (reaching 95% accuracy). However, the effectiveness is shown to be sensitive to the variation and quality of the images.
Background and Dataset
Given a set of images, one common analytical task is to classify them into distinct populations based on their contents. In facial recognition, for example, one needs to first classify an image as containing a face, and then try to match the face against known individuals.
In order to illustrate the range in effectiveness of PCA and LDA for such classification, I examined images from the FEI Face Database1. The data consist of 200 (260x360 pixel) images of individuals, with 50 smiling men, 50 neutral men, 50 smiling women and 50 neutral women.
 Neutral (M)
The photographed individuals spanned multiple ethnicities and a wide range of ages. The images themselves were centered on the face, taken at a common distance, and taken with consistent light levels.
 Smile (F)
In order to prepare the data for analysis, the images were transformed into multivariate observations by concatenating each column of pixels into one vector, and averaging the red, green, and blue channels of the pixels to create a single gray scale value in the interval . Additionally, the overall average image was subtracted from each observation to center the data.
The final design matrices (across each group ) are shown below, with variable and observation counts.
Analysis
In order to classify the different images into the various distinct populations, LDA can be applied. However, as the data have extreme dimensionality (), feature reduction needs to be performed before LDA analysis is applicable or practical. Additionally, high correlation between adjacent pixels means multicollinearity issues are likely. To reduce to a reasonable number, and orthogonalize the resulting variables, I chose to use PCA. Fortunately, the common scale of the pixels avoids scaling sensitivity issues with PCA.
Computational Considerations
While PCA is clearly useful in combatting inherent issues with the image data, one practical problem remains. In order to compute the principal components, one must perform an eigendecomposition of the covariance matrix. As the computational complexity of eigendecomposition can only be greater than that of matrix multiplication, without any simplifications we can expect an asymptotic runtime2 proportional to operations ( billion for these data).
To get around this issue, we can use the fact that the number of non-zero eigenvalues (corresponding to useful principal components) is bounded by the rank of the matrix. Furthermore, the rank of a covariance matrix is bounded by the number of observations. Therefore, we have for centered , . For some eigenvector of ,
If is an eigenvector of , then is an eigenvector of . We now only need to find the eigenvectors for (a much smaller matrix) to get all the eigenvectors (with non-zero eigenvalues) of .
PCA - FEI Face Data
After computing the principal components for the FEI dataset (combining all populations), it is immediately apparent that much of the information present in the images can be effectively represented in far fewer variables than the count of pixels.
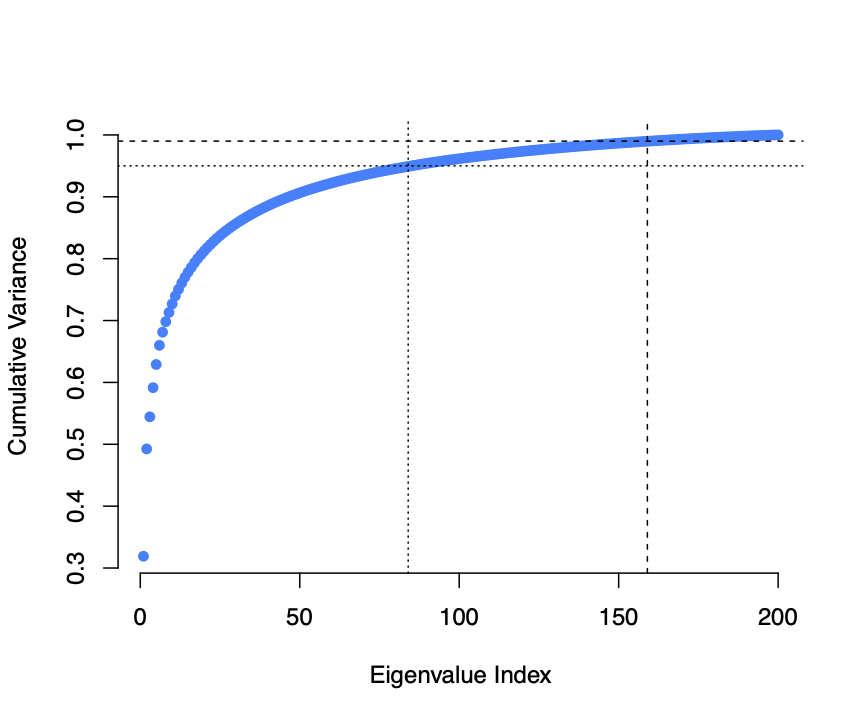 Cumulative explained variance of principal components derived from facial images.
As shown above, over 95% of the variance of the FEI data is captured by fewer than 90 principal components. Furthermore, the first PC alone captures over 30% of the variance. Plotting the first and second components of the FEI data against one another, we can see that the genders are clearly divided.
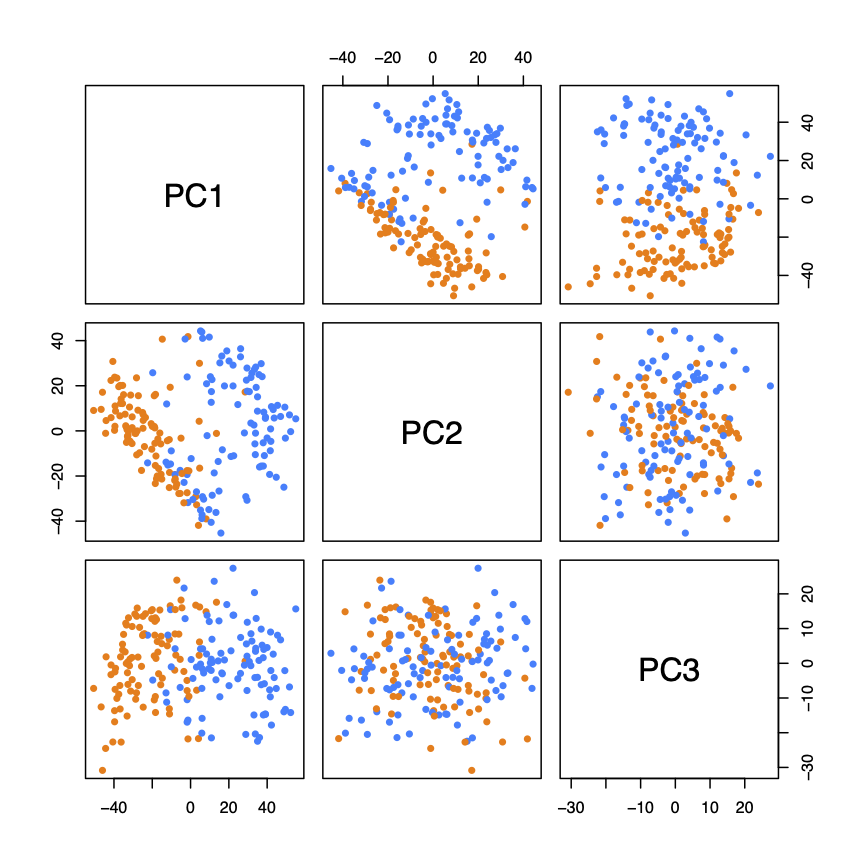 First three principal components with gender indicated
As shown below the pricipal components do not present a clean visual division between the types of facial expression.
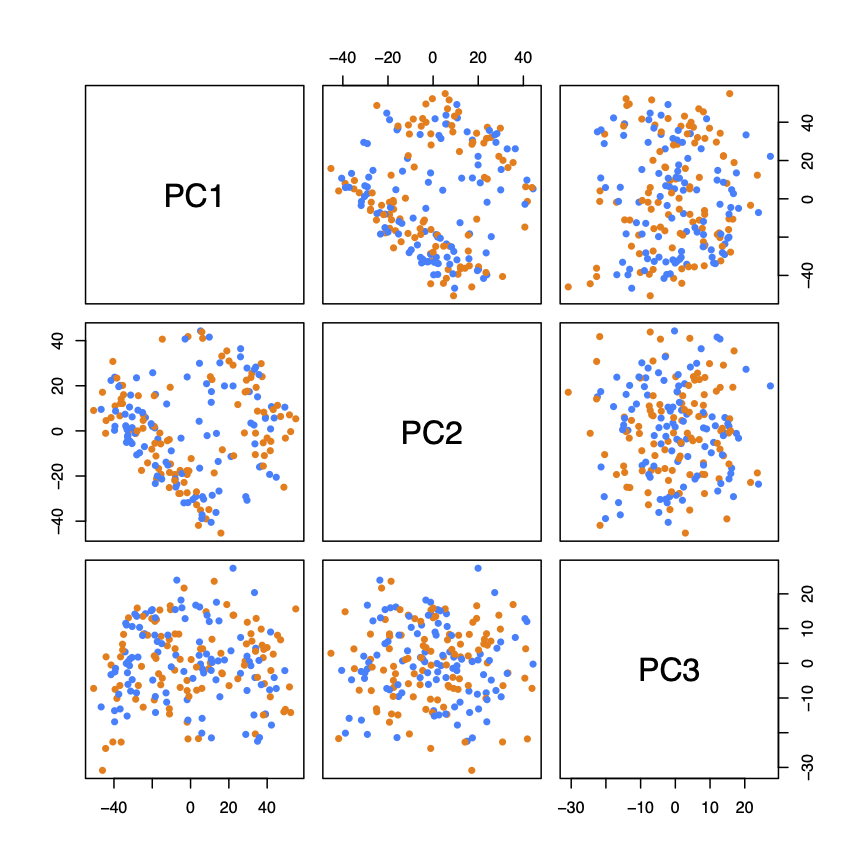 First three principal components with facial expression indicated
One particularly nice property of PCA for image analysis is that the eigenvectors can be shown as images themselves (often referred to as "eigenfaces")3. This allows for effective and intuitive illustration of image features that effectively divide the different populations.
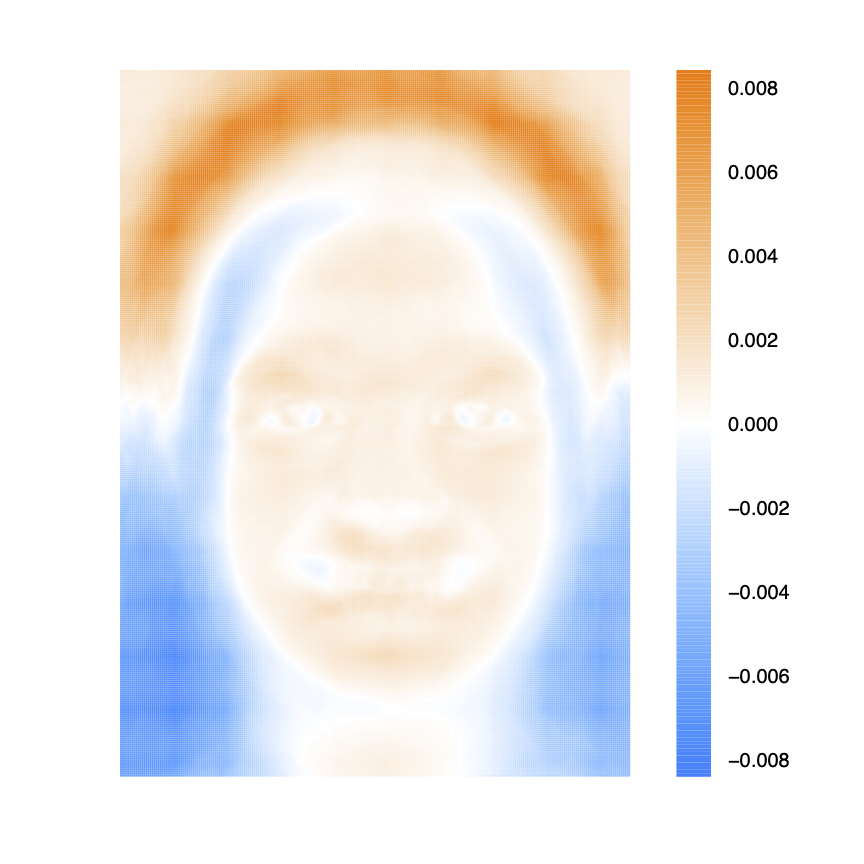 Heatmap of first PC from facial images.
Shown above, the components of the first eigenvector (from the facial image data) are mapped back to pixel positions and shown as a heatmap, where negative values are in blue and positive values in orange.
Comparing this heatmap to the computed average images for both genders, we can immediately see that the first PC captures differences in hair style and head shape between genders.
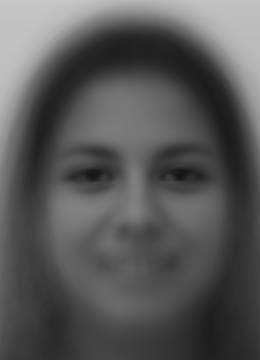 Average of all "Female" classified images
Juxtaposing the clean separation of genders by the first PC to the less clear separation of facial expression suggests that the subtlety / simplicity of the population differences has a strong effect on the efficiency of the resulting PC's.
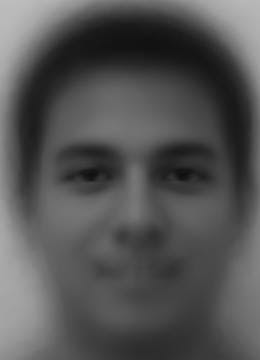 Average of all "Male" classified images
LDA - FEI Face Data
In order to classify the FEI face images as containing males or females, as well as whether or not the individual was smiling, LDA was performed on the computed principal components.
To test the LDA assumption of multivariate normality, I produced chi-squared plots of the principal components.
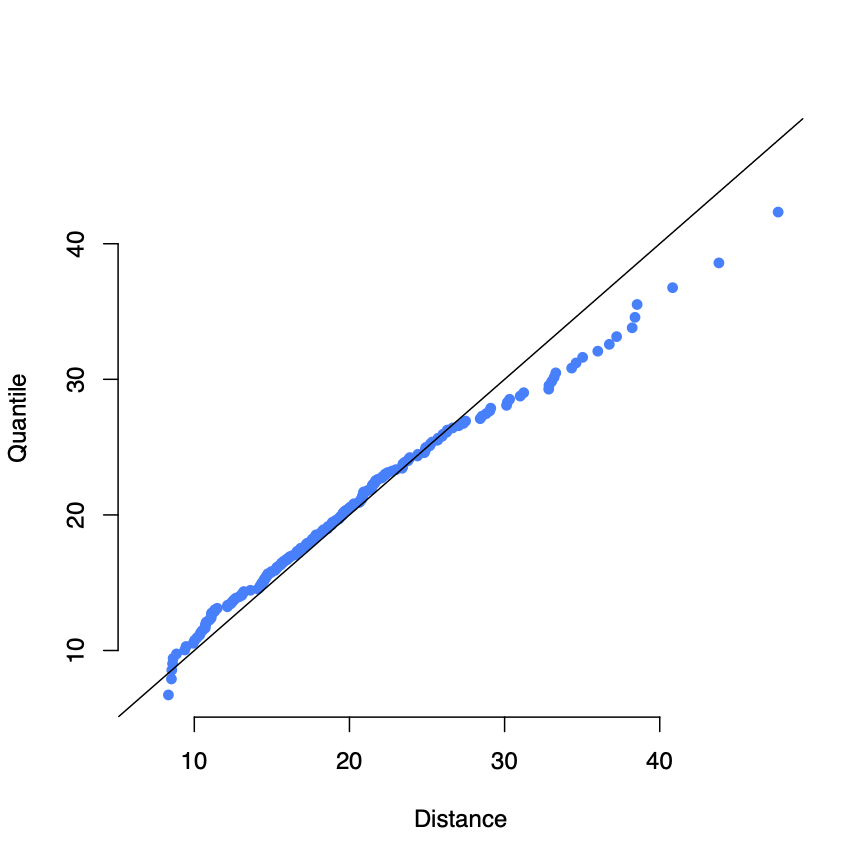 First 20 principal components from FEI Data
Examining the plot above, we can see a slight deviation from the line suggesting the principal components might not be mutivariate normal. As the values of the principal components include negative numbers, A Box-Cox transformation could not be applied. A Yeo-Johnson power transformation4 was tested, though it did not improve appearance of normality in chi-square plots or the Royston normality test.
However, the deviation is not intense and previous work5 has shown that for image object recognition, LDA can achieve good performance even with possible non-normality. Therefore, I proceed with LDA as a classification tool in this analysis.
Below, the accuracy rate for separate leave-one-out cross-validation (LOOCV) trials are displayed, with each LOOCV trial including the first principal components, .
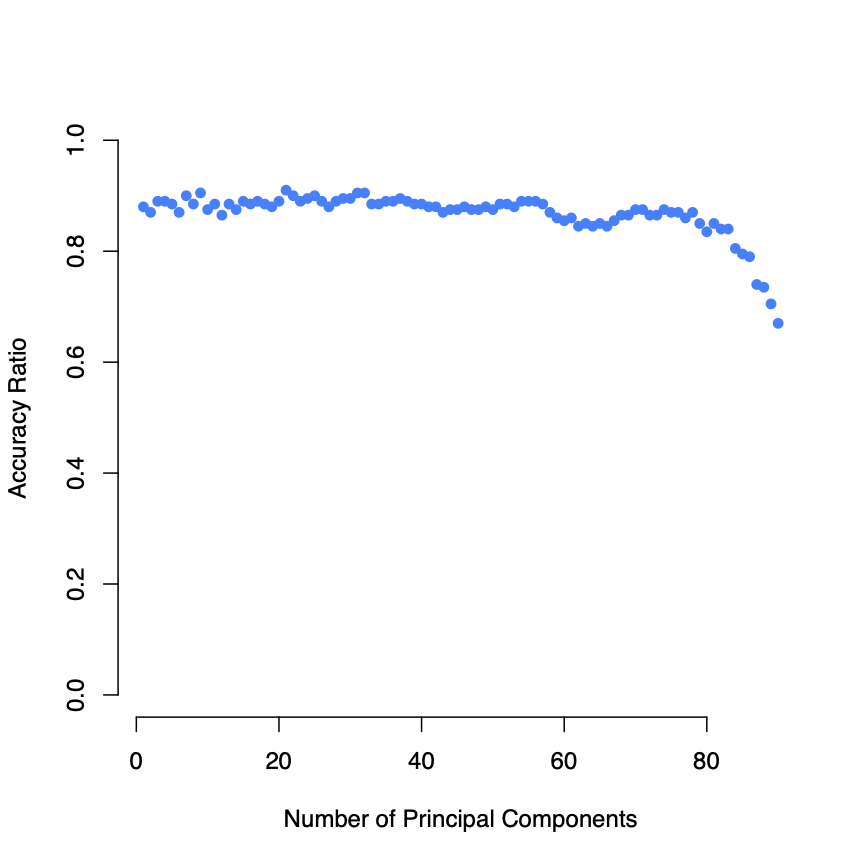
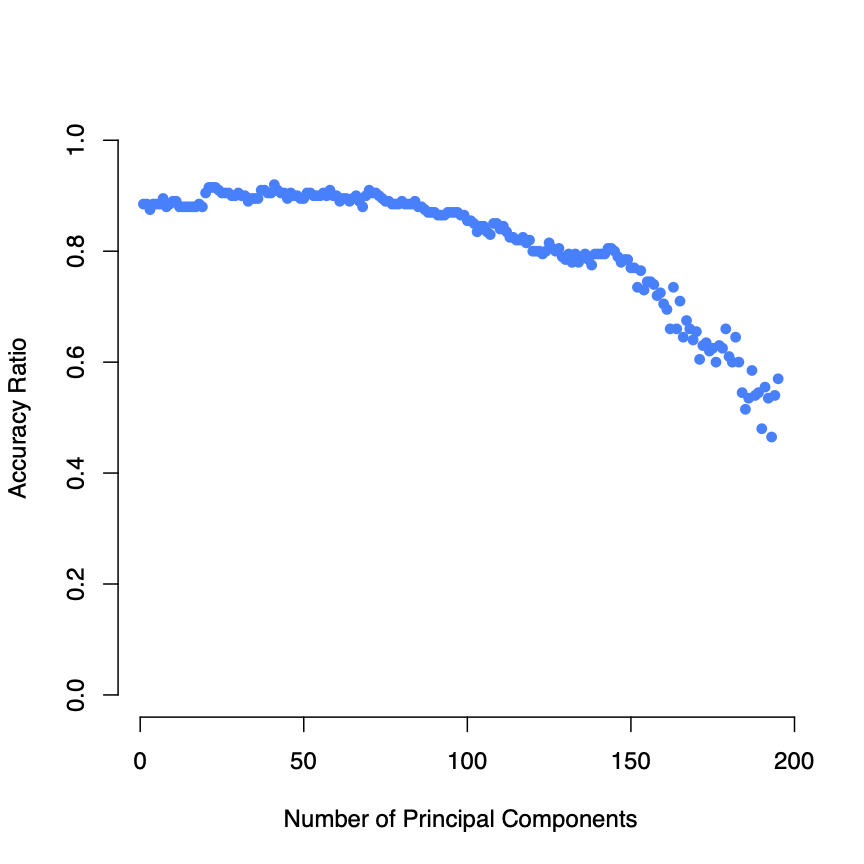 LOOCV accuracy for LDA classification of gender
As shown above, the model acheives high cross-validated accuracy with even just one principal component. This makes intuitive sense, given how well the data are linearly separated via the first principal component. Furthermore, accuracy rapidly decreases as the degrees of freedom fall with the inclusion of more principal components.
Next, examining the prediction accuracy for classifying facial expression as smiling or neutral, we see that it takes more principal components to reach similar levels of accuracy. As shown below, facial expressions are not as cleanly divided as gender in the first few PC's.
Overall, even with potential violation of the assumption of normality, LDA performs well at classifying the FEI images.
In addition to LDA analysis, QDA was performed (to relax the assumption of equal covariance matricies present in LDA). However, as shown below, it appears as if overall performance is roughly equal between the two models, perhaps due to the good linear separation of genders by the first PC.
 LOOCV accuracy for QDA classification of gender
Conclusion
After analyzing two different sets of image data, it is clear that PCA and LDA can be effective, accurate tools for classification of images.
The issues of high dimensionality and multicollinearity present in image data are effectively resolved through the use of principal components analysis. For images which have clear patterns separating populations, as was the case for hairstyle separating gender, principal components can be extremely efficient in identifying core object features.
With regard to Linear Descriminant Analysis, although the assumption of normality is not strictly satisfied, the empirical performance is strong.
Further investigation of this topic might take several routes. To relax the requirement of normality (and potentially further increase performance), logistic regression and support vector machine models might be appropriate alternative classifiers.
Additionally, further exploration of the affect of image quality and attributes on performance is merited. It is possible that LDA and PCA are sensitive to greater differences among images with respect to rotation, skew, and lighting.
References
Footnotes
-
Centro Universitario da FEI, FEI Face Database [Data file] (2012) ↩
-
Stothers, Andrew James. "On the complexity of matrix multiplication." (2010). ↩
-
Yeo, In‐Kwon, and Richard A. Johnson. "A new family of power transformations to improve normality or symmetry." Biometrika 87.4 (2000): 954-959. ↩
-
Li, Tao, Shenghuo Zhu, and Mitsunori Ogihara. "Using discriminant analysis for multi-class classification: an experimental investigation." Knowledge and information systems 10.4 (2006): 453-472. ↩